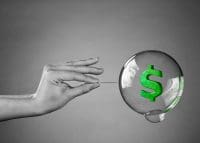
 Through last Friday’s markets close, the stock indexes have already had a great year. Dow, up 26; S&P 500, up 20; NASDAQ 100, up 31 percentages. Yes, we may still be only a Tweet away from disaster, but Mr. Market obviously has liked the change in business climate. Other than affecting the investing mood (sometimes known as animal spirits), let me again opine that US Presidents are not primary determinants of economic failure or success. They claim credit for and are blamed for things they should not.
Also remember that even the big indexes do not represent of all parts of our economy. Mid-sized and small corporations have increased in value by only 12 to 14 percent, but still nice gains. At the bottom of 2017’s heap are energy stocks. One energy index is barely positive this year and the S&P 500 Energy sector is still in the hole by 5 percent.
This is always the way it is. The Market is a collection of individual stocks and different kinds of businesses. The ones you own (whether in stocks, Exchange Traded Funds (ETF’s) or regular mutual funds) may or may not be in synch with broader indexes.
I don’t always agree with Jim Cramer of CNBC, but one thing he says is spot on: There is always a bull market somewhere! It has never before been so incredibly cheap and easy to invest in so many different places and ways. This is truly a golden age for investing.
But the question remains. Are we in another giant financial bubble looking for a time and place to pop? You can search and find almost any opinion you prefer for the answer. Let’s examine a few factors.
First, some would say we are obviously in a bubble just because these indexes are at all time high points. This quick assessment does not take into consideration the effects of long term inflation. When a dollar is worth less every year, over time the price of company stocks must inflate also since they represent tangibles and intangibles measured in cheaper bucks.
Second, let’s look at the Price/Earnings ratio or PE. How much does it cost to obtain $1 worth of company earnings from a given stock? This ranges from extremely high numbers to very low during cycles. Currently S&P 500 companies have an average PE ratio of 25.64. But the long term average is just under $16 of stock price per $1 of annual corporate profit. So this is obviously a higher point than usual.
Third, Professor Robert Schiller of Yale devised a measure called the Cyclically Adjusted PE Ratio. It is designed to smooth out the effects of inflation upon PE ratios. I could put you into an even deeper sleep, but suffice it to say that by his method, the current reading of 32 is the second highest of any in the past 120 or so years.
My personal addition to this valuation soup is to compare the PE ratio to the rate of growth of company earnings. For example, if Apple has a PE of 18.75, higher than the typical market average, but its earnings grew by almost 11 percent, I would say the higher PE number is probably warranted.
On the other hand, Caterpillar is ridiculously expensive with a PE of 99 (with falling earnings in the past year) unless you expect the earth moving business to explode and Cat’s sales and earnings with it. Overall, our view is that company sales and earnings will continue to grow well in the near future. Therefore, we are not in a stock market bubble yet. But as you well know, past performance is no guarantee of future results!
(Advice is intended to be general in nature. Statistics are derived from Worden Brothers, Inc., TC2000, 2017.)
